Bathymetry
 What is Bathymetry?
Bathymetry is the measurement of depth of water in oceans, seas, or lakes.
How is bathymetry represented in the Ocean Tracks map?
- The bathymetry data layer shows the features on the ocean floor that you would see if you drained away all of the water. In reality, of course, you wouldn’t see these features if you looked down at the ocean water surface, because the water depth of the Pacific averages 4,028 meters (14,000 ft or 2.7 miles)!
- The darker blue colors on the map represent deeper areas of the ocean, and lighter blue areas represent shallower areas.
What bathymetric features can you see in the Northern Pacific?
In the North Pacific basin, where Ocean Tracks is focused, there are a variety of different sea floor features that are of interest, and that play a role in the distribution of marine animals. Each of these features has their own, unique inhabitants; and each of the features can also affect the physical, chemical and biological environment above them in the open ocean.
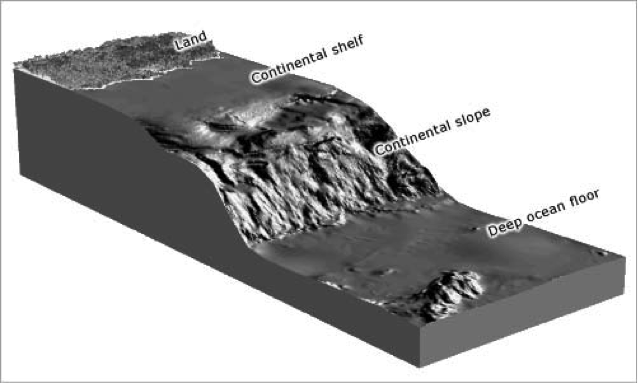
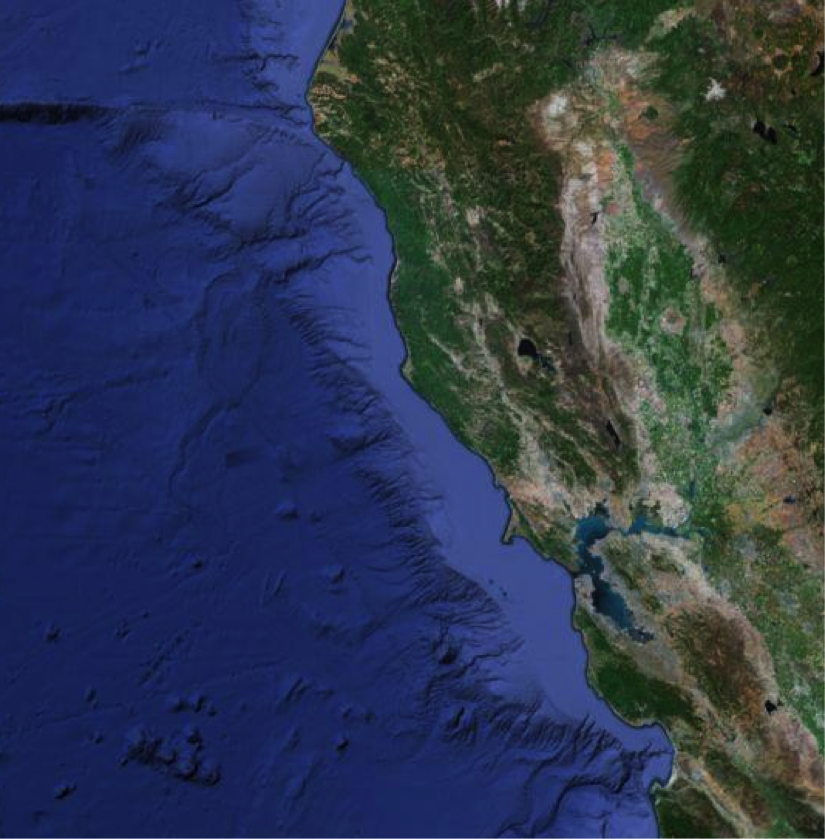
Continental Slope
- Along the North American coastline, there are many places where the sea floor drops off quickly not far from shore. Winds and currents interact in coastal areas to generate the upwelling of cold, nutrient-rich water along the continental slope. More details on upwelling are in the section on ocean currents.
This view of the bathymetry off the coast of California shows that the sea floor is fairly shallow close to shore, then it drops off steeply.
Seamounts
- Seamounts are actually undersea mountains that don’t reach the water surface (the peaks of mountains that reach above the ocean surface become islands!).
- Often seamounts are extinct volcanoes. There are approximately 100,000 seamounts across the globe, reaching heights as much as 4,000 m (13,000 ft) measured from their base to their peaks. Most of these mountains have not been explored because they are so far below the surface.
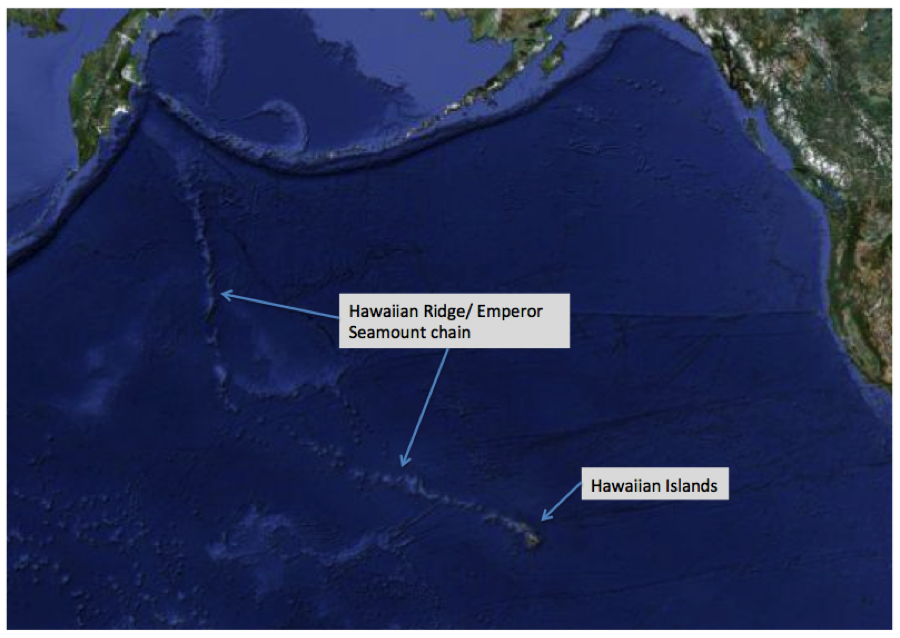
- You’ll notice when you study the Ocean Tracks bathymetry map that there is a chain of seamounts extending north from the Hawaiian Islands (see image below). This chain of undersea mountains is important evidence of plate tectonics. Hawaii is above a volcanic hot spot in Earth’s mantle, and as the Pacific Plate has moved in a northwesterly direction over millions of years, the volcanic islands have moved with the plate away from the hot spot in the underlying mantle, and new islands have formed.
- Mauna Kea, the tallest island in Hawaii, measures 10,200 meters (33,500 ft) from its base on the ocean floor to its peak. That’s more than twice the base-to-peak height of Mt Everest!
- For more information about the formation of the Hawaiian Islands and related chain of seamounts on the Pacific Ocean floor see http://pubs.usgs.gov/gip/dynamic/Hawaiian.html
Abyssal Plains
- The seamounts rise from vast abyssal plains which cover huge expanses of the sea floor – not unlike the Great Plains on land. The abyssal plains cover more than 50% of Earth’s surface and are the most unexplored portions of the planet.
- The abyssal plains are largely covered by fine sediments, including clay and silt. Highly diverse communities of microbes and invertebrates inhabit these sediments, feeding on material that drops from the overlying water column.
- Hydrothermal vents occur at abyssal depths where water heated by volcanic rock deep within the earth’s crust escapes from cracks, or fissures in the earth’s crust. These superheated waters contain minerals, which attract rich communities of organisms. These organisms use chemicals in this water, such as hydrogen sulfide, to generate energy.
- Cold seeps also occur near fissures in the earth’s crust, and release compounds such as oil and methane into the water column. These areas also attract highly unique communities of organisms that use methane to produce energy.
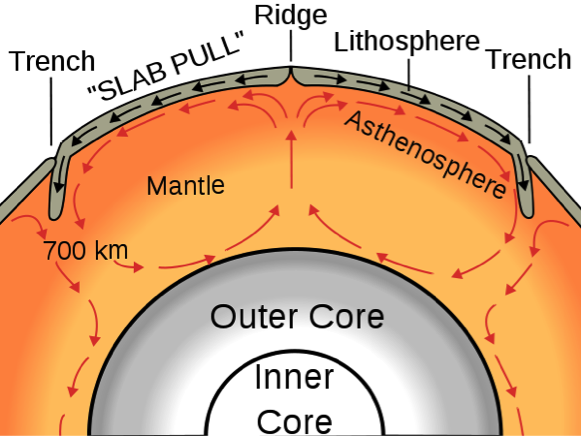
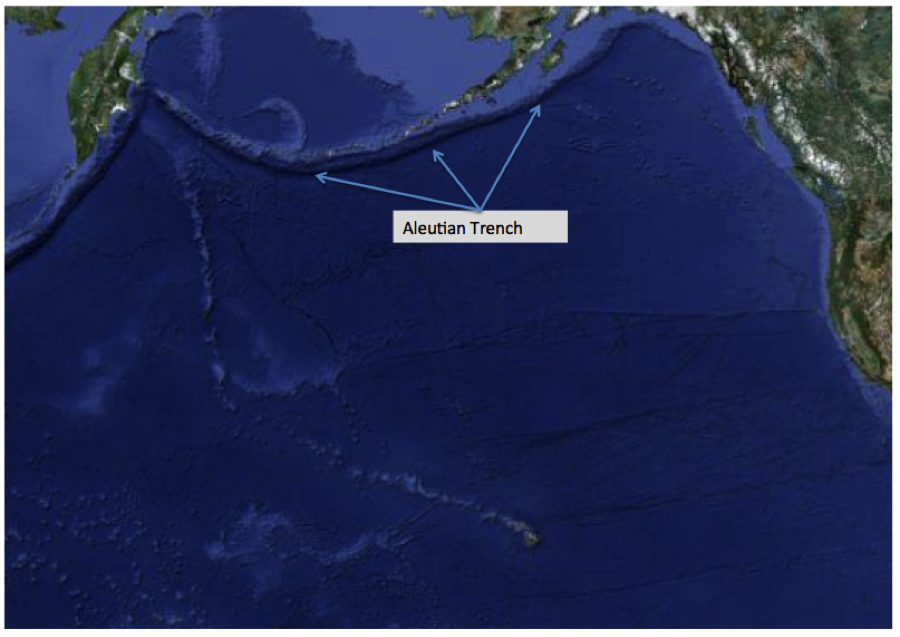
Trenches
- Oceanic trenches are long, narrow depressions in the sea floor, which are visible as dark blue lines ringing the edge of the Pacific Ocean basin. These trenches form where two tectonic plates are moving toward each other, and one dives beneath the other in a subduction zone.
- The Mariana Trench is the deepest point in the ocean, reaching a depth of ~10,900 m ( ~35,800 feet, or 6.8 miles) below sea level at its deepest point.
- The Aleutian Trench, which stretches from Alaska to Siberia, extends to a depth of 7,822m (25,663 ft – almost five miles!) at its deepest point.
There are many other features you may also notice revealed by the bathymetry map of the Pacific Ocean floor. These features are clues that the ocean floor is moving and changing due to plate tectonic forces. To learn more about plate tectonics and how it shapes Earth’s surface see http://pubs.usgs.gov/gip/dynamic/dynamic.html.
How is the bathymetry important to marine life?
Although the features on the ocean floor may be invisible to humans at the surface, they are a very important part of the marine animal’s world. When we think about ecosystems on land, we might think about the prairie, a river valley, or an alpine meadow. Each of these ecosystems is created, at least in part, by the underlying land forms, and the geological processes that shape them. Ocean ecosystems are also shaped by the land forms on the sea floor. There are plains, mountains and valleys – and each of these features supports different ecosystems – on the sea floor surface, as well as in the sediments and rocks beneath it, and the water column above it.
- Bathymetric features such as the continental shelf and seamounts interact with ocean currents and winds to produce regions of upwelling, where nutrient-rich waters are brought to the surface. This nutrient-rich water supports high levels of primary production by phytoplankton, which in turn attracts larger organisms.
- Seamounts are colonized by organisms that filter food particles out of the water column, called “filter feeders”. These organisms trap food in water as it is upwelled along the edges of seamounts.
- Larger organisms such as fish and mammals are attracted to the productive feeding grounds on the surface of seamounts and in the overlying water.
- The image below shows a three-dimensional view of the actual track of an elephant seal projected onto a bathymetry map. You can see that it spends quite a bit of time diving up and down around the top of a seamount. The seal is likely feeding on organisms that inhabit the seamount.
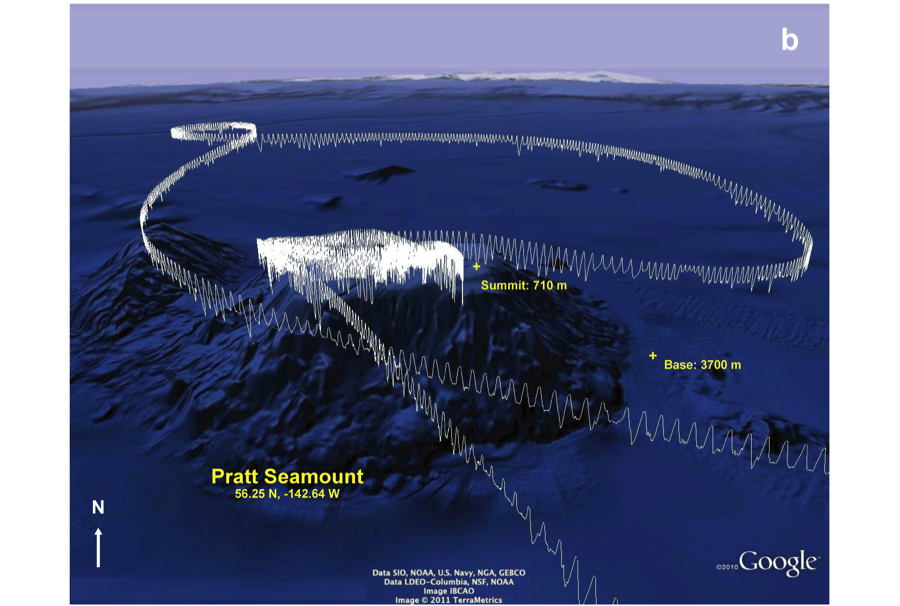
Source: Maxwell, S. M., J.J. Frank, G.A. Breed, P.W. Robinson, S.E. Simmons, D. Crocker, J. Gallo-Reynoso, and D.P. Costa (2012) Benthic foraging on seamounts as a specialized foraging behavior on seamounts by deep diving marine mammal. Marine Mammal Science 28(3): E333-E344.
How was this bathymetry map created?
- Bathymetric maps are generated using instruments that measure depth.
- Traditionally depth was measured by dropping a heavy rope or cable over the side of the ship and measuring its length when it reached the ocean bottom. Could you imagine trying to map the entire sea floor this way? It would require a lot of effort. Measurements generated this way were also often inaccurate because currents would pull the rope to one side as it dropped.
- Now, sound waves are used to measure the ocean bottom. Ships send out pulses of sound, which bounce off the ocean floor. The time it takes for the sound wave to return back to the ship after it is generated is used to determine the depth of the ocean bottom. Specifically, the longer it takes for the sound to return, the deeper the water is.
- Scientists have developed “multi-beam sounders” which send out sound pulses in hundreds of narrow beams. The advantage of these types of sounders is that they can give a much more detailed picture of the shape of the object that sound is bouncing off of. Scientists can actually tell whether the ocean bottom is soft or hard from the picture generated by a multi-beam sounder (education.nationalgeographic.com).