Sea Surface Temperature
What is Sea Surface Temperature?
Sea surface temperature (SST) is the water temperature close to the ocean's surface.
The exact meaning of surface varies according to the measurement method used, but it is between 1 millimetre (0.04 in) and 20 metres (70 ft) below the sea surface. (Source: Wikipedia)
How is SST Represented in the Ocean Tracks Map?
- This first map layer you’re looking at shows the temperature of the water at the ocean’s surface, referred to as sea surface temperature (SST).
- SST is influenced by how much of the sun’s radiation comes in contact and is absorbed by the surface of the ocean.
Formation of Spatial Patterns
- The sun isn’t the only thing that influences SST. Take a look at the map of SST from the Pacific Ocean (below). Notice areas of warmer water (shown in red and orange hues) and areas of colder water (shown in blue and purple hues). We would expect SST to decrease uniformly from the equator, where the most solar radiation occurs, to the poles. Does this seem to be the pattern in the map below?
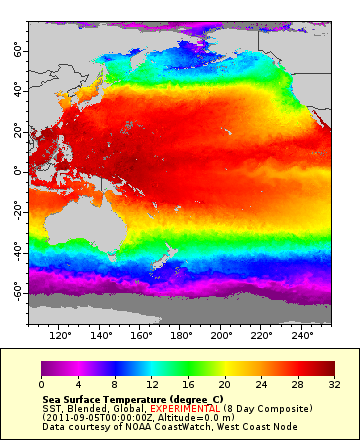
- Generally, yes, but notice that there are some areas, such as along the coast of California, where cooler water is farther south than you’d expect. This is because currents, winds, and freshwater input (from precipitation and run-off from land) also influence SST (Solovev and Lucas 2006). For example, currents running from north to south from Alaska to California bring cold water down the coast.
- Sea surface temperature changes on a daily (diurnal), seasonal, and yearly basis, but these changes are not as great the changes in air temperatures. This is because water has a higher specific heat than air, meaning that it takes more energy to raise and lower the temperature of water than it does for air (Segar 1998).
How is SST measured?
- You’re probably most familiar with measuring temperature using a thermometer. Historically, temperature was measured using thermometers on shorelines, ships and buoys (http://podaac.jpl.nasa.gov). Fortunately, we don’t have to use billions of thermometers readings throughout the world’s oceans to generate the global temperature map.
- Today global maps of SST are generated using data collected by satellites orbiting the earth. As water molecules absorb heat from the sun, they emit waves of electromagnetic radiation (a particular form of energy). Water molecules will emit electromagnetic radiation at varying wavelengths depending on the temperature of the water. These wavelengths can be read by instruments on satellites and used to generate a global map of sea surface temperature.
- You’ll notice at times that there are gaps in the temperature maps generated from satellites. This is because things like clouds and ice can prevent measurements in some regions of the globe.
- Typically, satellite-derived temperature maps show SSTs averaged over 8 days, 1 month, or longer. We can average data over several days or months to fill in gaps in daily measurements where clouds or ice move out of view.
Biological Implications
- The temperature of the surface of the ocean influences the distribution of animal and plant life.
- Each species has its own individual temperature tolerance that is based on physiological processes.
- Temperature is linked to the concentration of nutrients in the water (see information on Chlorophyll), which together with the amount of solar radiation influence the amount of primary production at the surface of the ocean.
- Because of this, scientists use temperature maps to predict where species occur and where primary production is highest in the ocean.